Loading…
Blog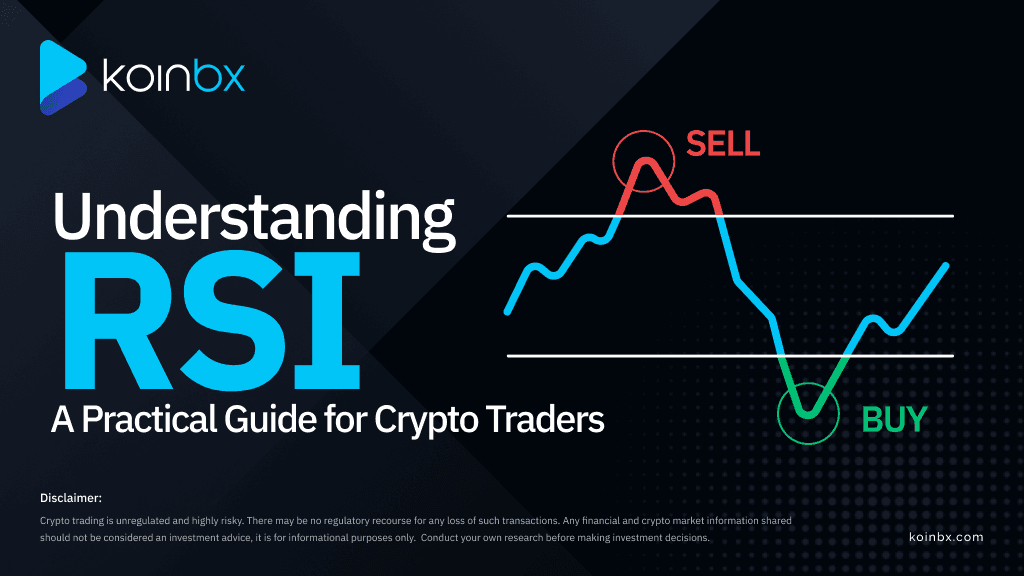
Step-by-Step Guide to RSI in crypto trading
04/03/2025, 09:55:47 am
Article Content
Technical analysis plays a key role in helping traders analyze price points and potential future market movements. By studying the charts and key levels, traders gain insights about assets and make smart trading decisions. The Relative Strength Index (RSI) is a technical indicator used to measure price movements. By identifying the overbought and oversold conditions, traders can predict trend reversals and progress. Therefore, understanding RSI is essential for crypto traders to profit from price movements.
In this blog, we will discuss the fundamentals, how RSI works, and provide a step-by-step guide to using RSI effectively. This knowledge of technical analysis and momentum indicators helps you use RSI effectively. Let us start the blog with some fundamentals.
What is RSI (Relative Strength Index)?
The Relative Strength Index (RSI) is a momentum oscillator that helps traders measure the speed and change of the asset price. The RSI indicator was introduced in 1978 and has now become one of the most widely used technical indicators in the crypto space. These indicators help traders to predict the potential entry and exit points with simple analysis. This is a reliable method to understand the weakness of a price trend during volatile market conditions.
Typically, RSI indicators indicate a value ranging from 0 to 100. Based on the RSI reading value, the traders can predict the overbought or oversold conditions. For example, if the RSI value is above 70, it denotes overbought conditions. An RSI value less than 30 denotes oversold conditions. The values between 40 and 60 are generally viewed as neutral, which represent the trend continuation. The indicator’s effectiveness may vary depending on the asset or trading style.
How does RSI work?
The Relative Strength Index (RSI) is calculated over a 14-day timeframe by comparing the average gains and average losses of a crypto asset’s price. Average values are calculated for profits and losses to compute the RSI value. The calculated value ranges from 0 to 100, representing the price momentum.
- The overbought condition is a signal for price reversal.
- The oversold condition signals buying opportunities at the time.
- Neutral value represents that the price trends continue to flow.
By referring to these conditions, traders can identify when to enter or hold positions during crypto trading. This is the reason RSI indicators are considered a vital tool to predict volatile market movements effectively.
Step-by-Step Guide to Using RSI
1. Identifying Overbought and Oversold Conditions
The Relative Strength Index (RSI) value offers crucial insights into market conditions. Identifying the overbought and oversold conditions is key to predicting price movement and corrections.
2. Confirming Trend Reversals
RSI can also help confirm potential trend reversals:
- Bullish Reversal: Occurs when the RSI moves from below 30 and crosses above it, indicating a possible upward trend.
- Bearish Reversal: Occurs when the RSI moves from above 70 and crosses below it, indicating a possible downward trend.
These reversals provide critical signals for traders looking to capitalize on changing market conditions.
3. Divergence Analysis
Divergence occurs when the price of an asset and the RSI move in opposite directions. This can be a powerful signal:
- Bullish Divergence: When the price makes lower lows, but the RSI makes higher lows. This suggests that the downward momentum is weakening, and a price increase my follow.
- Bearish Divergence: When the price makes higher highs, but the RSI makes lower highs. This suggests that the upward momentum is weakening, and a price decrease might follow.
Developing a Trading Strategy with RSI
Here are the simple guidelines to develop a trading strategy using RSI.
- Combine RSI with other indicators: RSI works well with other technical indicators like Moving Averages, MACD, or Bollinger Bands to confirm accurate signals.
- Set clear entry and exit points: Define at what RSI levels you will enter or exit a trade. For example, buy when RSI crosses above 30 and sell when it crosses below 70.
- Use stop-loss orders: Protect yourself from unexpected market movements by setting stop-loss orders based on RSI signals.
- Analyze your strategy: Test your trading strategy by comparing it to the historical market data. This can help you avoid the possible losses.
Common Mistakes to Avoid with RSI
While RSI is a powerful tool, it’s not foolproof. Avoid these common mistakes:
- Ignoring other indicators: Relying solely on RSI without considering other market factors can lead to poor trading decisions.
- Overtrading: Frequent trading based on RSI signals can lead to high transaction fees and reduced profitability.
- Failing to adjust settings: Different assets and time frames may require different RSI settings. Customize your RSI settings to suit your specific trading strategy.
Bottom Line
The Relative Strength Index is a versatile and widely used tool in crypto trading. By understanding its signals and incorporating them into a comprehensive trading strategy, you can enhance your decision-making and potentially improve your trading outcomes. Remember, while RSI provides valuable insights, it should be used in conjunction with other indicators and sound risk management practices.
Download KoinBX Android App | Download KoinBX iOS App
Disclaimer: Any financial and crypto market information shared should not be considered investment advice. It is for informational purposes only. Conduct your own research before making investment decisions. Crypto trading is unregulated and highly risky. There may be no regulatory recourse for any loss of such transactions
Share Post
Share this article with your friends and community!